LOFAR beam measurements L86097

Back to index-page

AntennaSet LBA_OUTER
Filter LBA_30_90
Field Cyg A field 001
Subband [276]
ObservationDate 2013-01-30
AntennaArray LBA
cs001c cs002c cs003c cs004c cs005c cs006c cs007c
no data no data no data no data no data no data no data
cs011c cs013c cs017c cs021c cs024c cs026c cs028c
no data no data no data no data no data no data no data
cs030c cs031c cs032c cs101c cs103c cs201c cs301c
no data no data no data no data no data no data no data
cs302c cs401c cs501c de601c de602c de603c de604c
no data no data no data no data no data no data no data
de605c fr606c rs106c rs205c rs208c rs210c rs305c
no data no data no data no data no data no data no data
rs306c rs307c rs310c rs406c rs407c rs409c rs503c
no data no data no data no data no data no data no data
rs508c rs509c se607c uk608c
station station station station

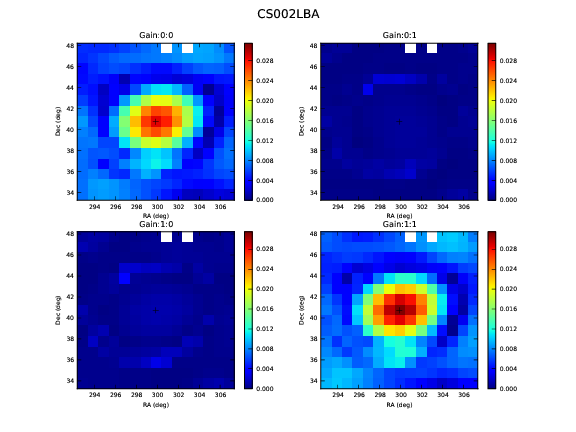
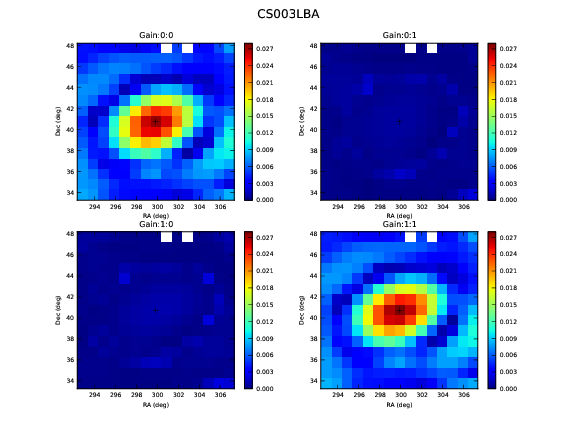
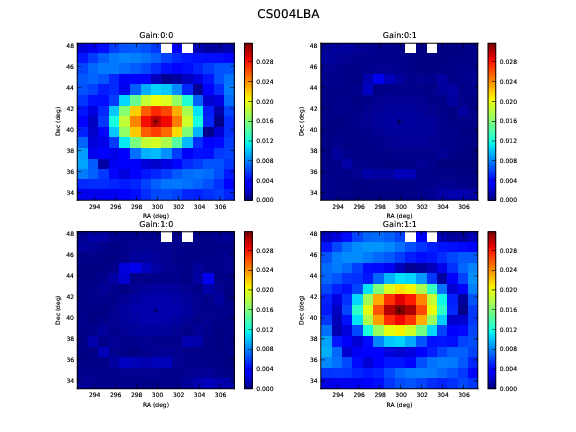
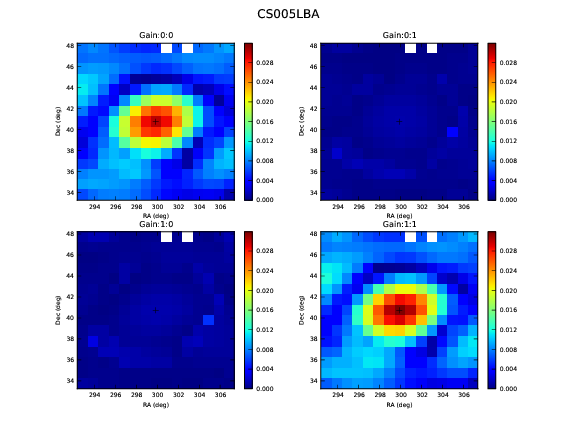
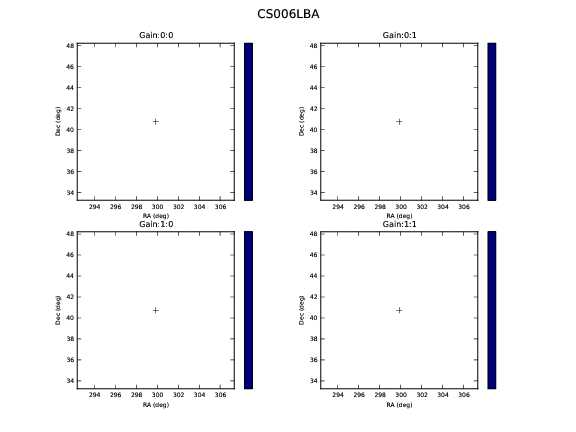
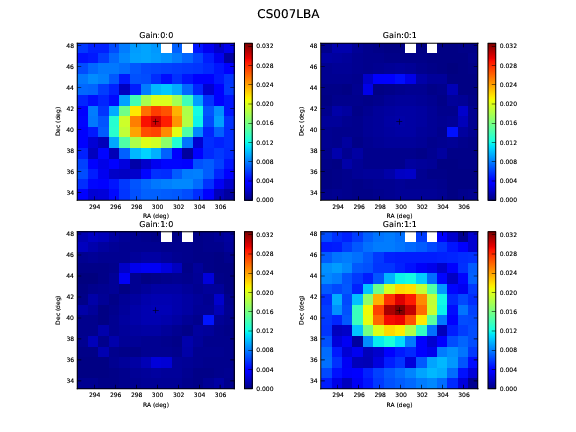
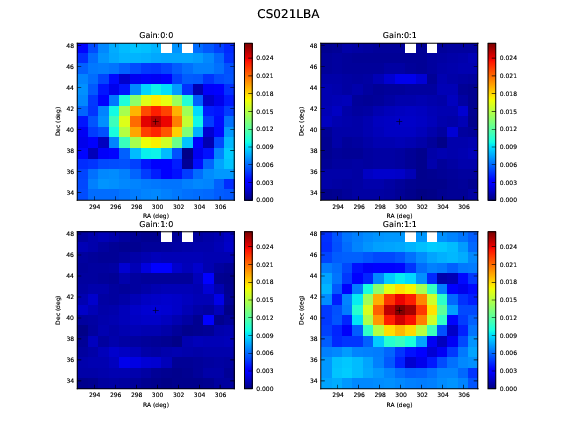
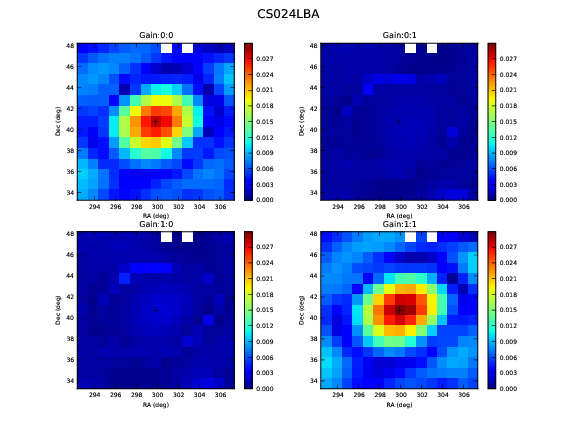
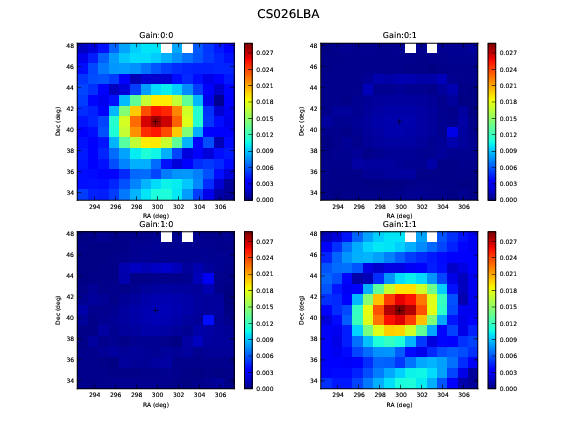
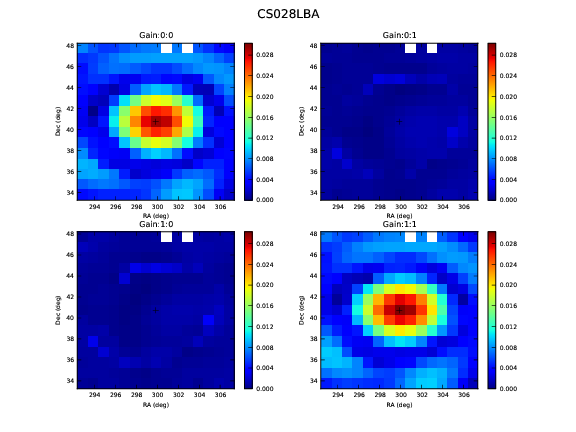
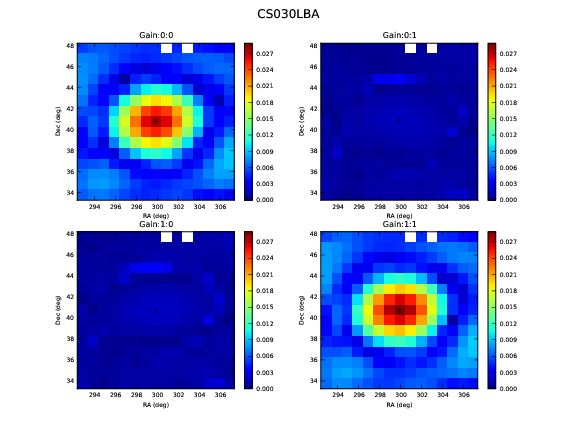
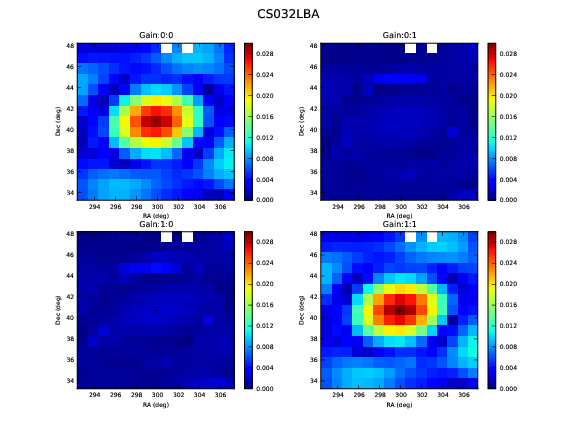
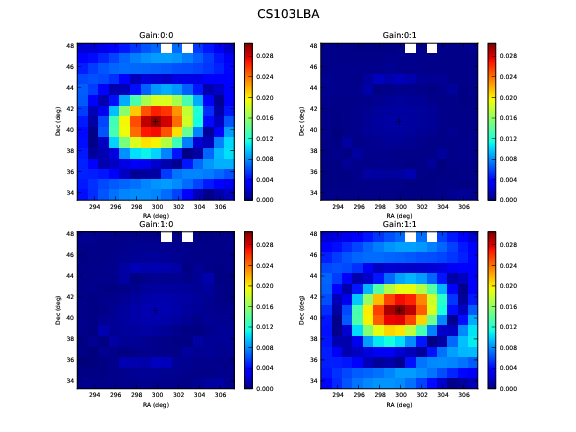
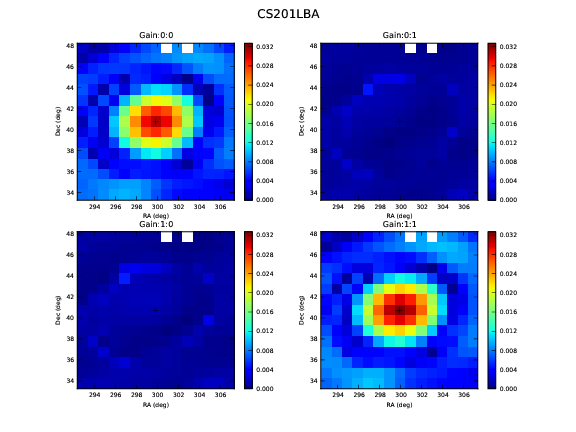
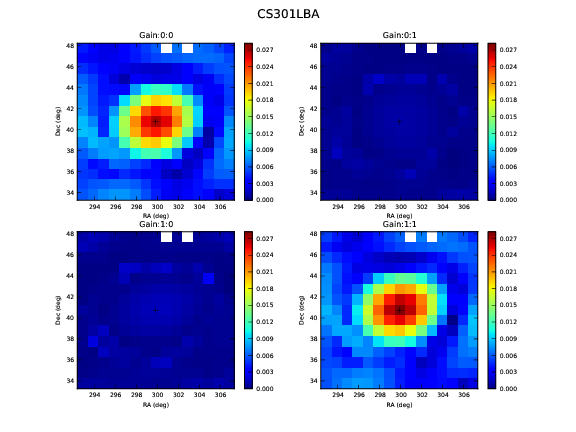
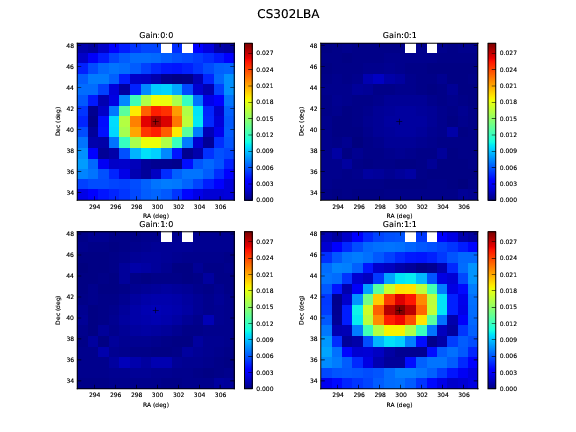
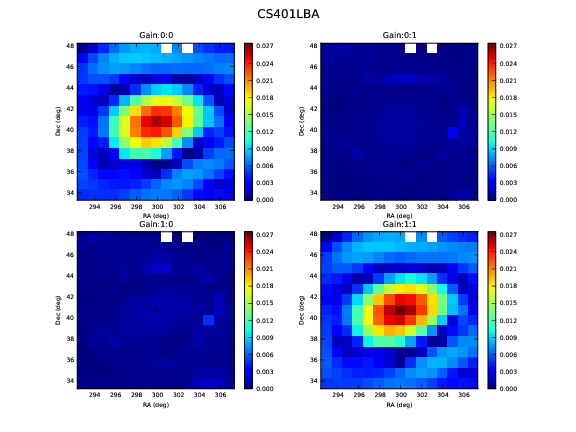
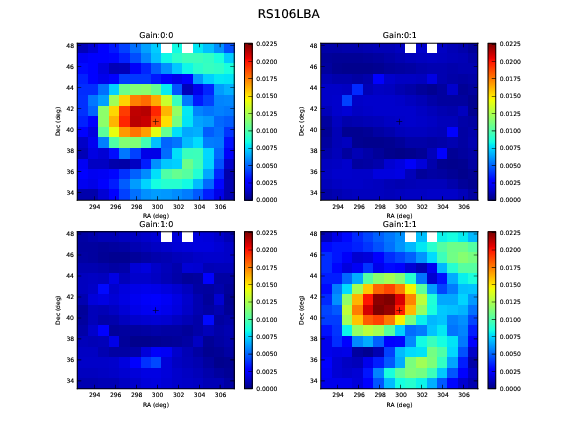
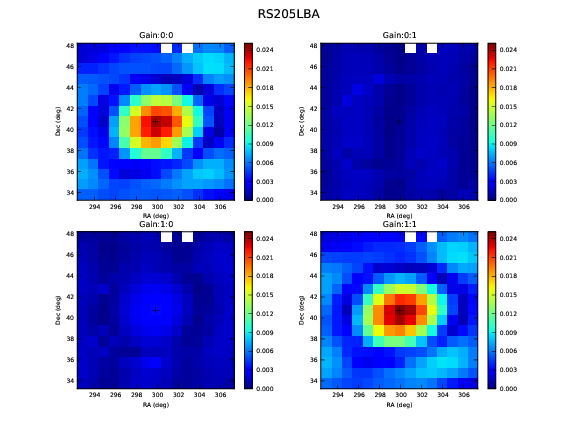
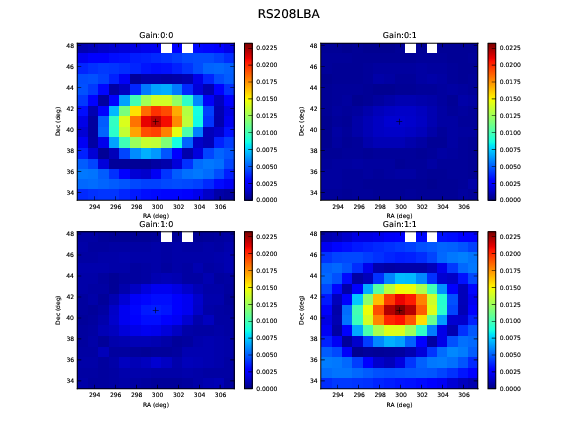
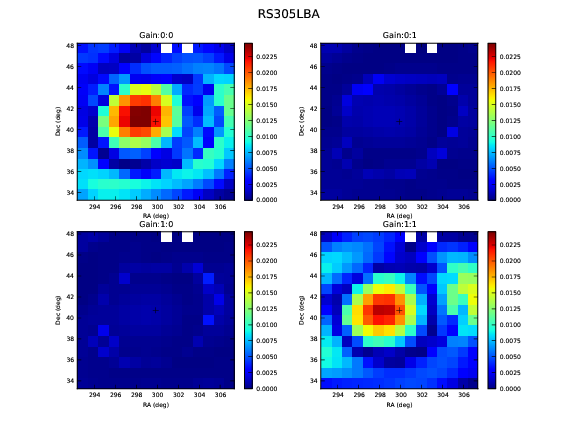
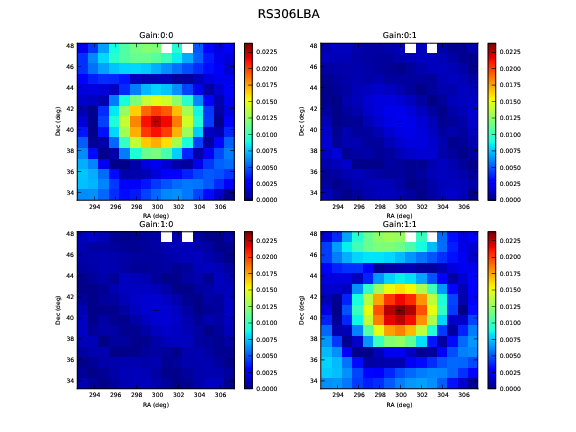
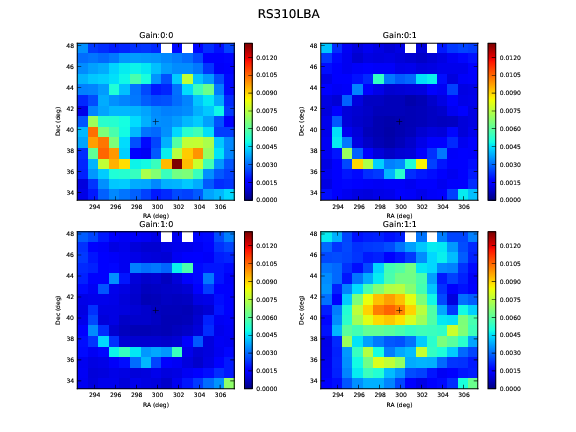
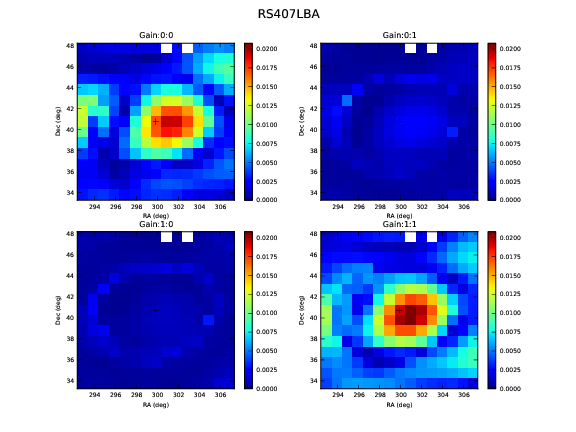
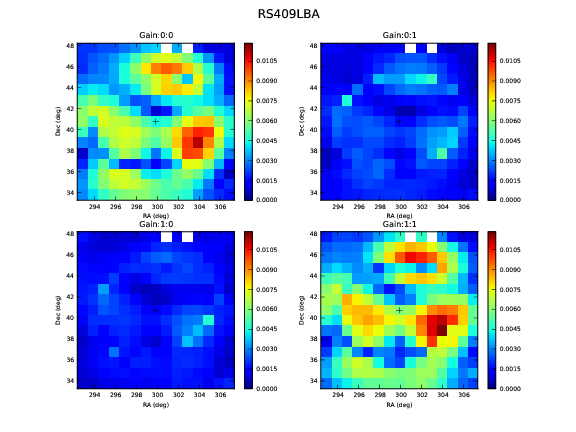
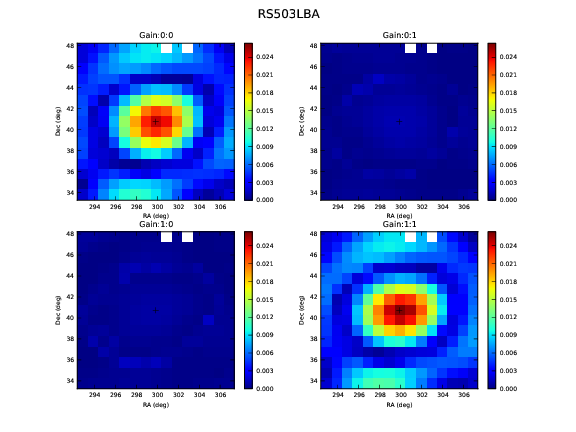
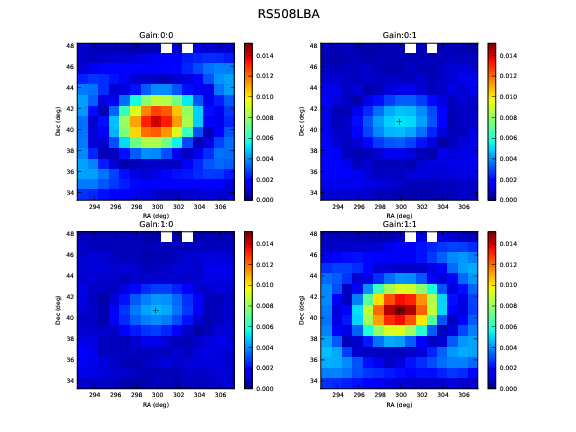
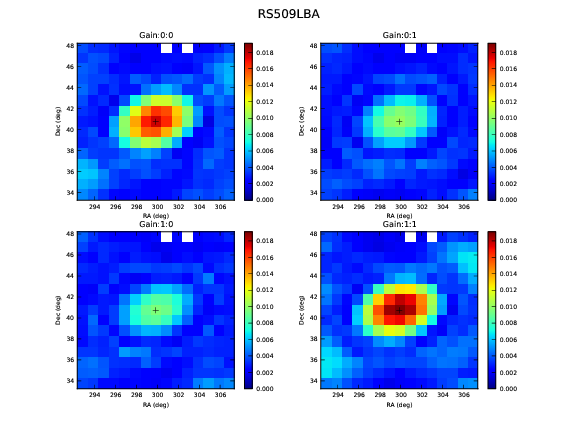
Each pixel in a plot corresponds to a single pointing of a 225-beam observation. The x and y axes are in degrees, and represent offsets from the central pixel which is at the coordinates of CygA. The range in each plot is set to scale between 0 and the maximum gain for that station. White pixels correspond to pointings which did not record data to disk (usually due to cluster problems). The four subplots correspond to the four (complex) elements of the Jones matrix that we assume describes the beam response. Only the amplitude is plotted.